| Hoe goed werkt EBM (Evidence Based Medicine), wanneer je einddoel “maximaal gezondheid produceren” is? Waarom moet je zeer voorzichtig zijn met statistiek wanneer je menselijk gedrag positief wil ombuigen naar gezond leven? Bijna honderd studies, 2,8 miljoen onderzochte elektronische dossiers en 270.000 overlijdens lijken een overtuigend bewijs te leveren dat je met een “normale” BMI een groter risico op overlijden hebt dan wanneer je licht of matig zwaarlijvig bent. Maar hoe zit dat nu écht? Wat moeten we onthouden, vertellen of tonen wanneer mensen de waarheid nodig hebben om zichzelf te motiveren iets aan hun (over)gewicht te doen? Wat geloof je?
Uit een Amerikaanse meta-analyse, gepubliceerd in JAMA in januari jl., kon je afleiden dat je kans op overlijden groter werd, naarmate je een “gezondere” BMI had. Overgewicht en (lichte vormen van) obesitas zouden je kans op overlijden paradoxaal genoeg verminderen! In onderstaande tabel zet ik de essentie van drie studies even naast elkaar. Mijn aandacht werd getrokken door een posting op DocCheck News van Philip Greatzel. Die ging op zoek naar “de waarheid” in dit complexe EBM verhaal, omdat (o.a.) in Duitsland de discussies tussen “believers” en “non-believers” nog steeds woedt. Want in Beieren was men toch ook onder de indruk van het feit dat dikke mensen gezonder zouden kunnen zijn dan magere. De retrospectieve Duitse TEMPiS studie gaf een gelijkaardig beeld: de kans op beroerte en hartaanvallen is lager wanneer je zwaarlijvig of obees bent dan wanneer je een “normale” BMI hebt. Ronduit magere mensen lopen zelfs het hoogste risico! Wie de TEMPiS of JAMA studies wil lezen moet wel even in zijn geldbuidel grijpen, want geen van beiden zijn “open source”, maar wel “wetenschap volgens het klassieke business model”. Hoewel dit EBM op zijn mooist is en de statistische bewijzen overweldigend zijn, laat onze geest zich niet zomaar overtuigen van “de waarheid”. Gereputeerde wetenschappers en gewone zorgverstrekkers stellen de resultaten in vraag, omdat ze afwijken van wat we gewoon zijn te geloven en wat we jarenlang hebben aangeraden aan mensen. In volgende boekbespreking ga ik wat dieper in op de redenen en mechanismen die ons “geloof” in dit soort situaties bepalen en die ons gedrag – meestal weinig rationeel – bepalen. De waarheid ligt elders
Lees eerst even de conclusies van de twee eerste studies in onderstaande tabel. Ga je ook twijfelen...? Philip Greatzel ging ook verder op zoek en vond een derde studie in de NEJM uit 2008, geüpdated in 2010. Die is niet alleen “open source”, zodat iedereen gratis kan kijken en keuren wat ze te bieden heeft. Ze geeft ook een genuanceerder en veel geloofwaardiger beeld van het hele “BMI en gezondheid” verhaal. En als kersje op de taart biedt ze ook een coherente en heel praktische aanpak om mensen uit te leggen hoe en vooral “waar” je op je gewicht moet letten. Het volstaat eigenlijk de twee figuren (zie onderaan, achter de vergelijkingstabel) te bekijken om meteen een “beeld” te krijgen van waar het risico precies ligt. De onderverdeling van de BMI categorieën bij de NEJM studie was fijnmaziger, waardoor men een objectiever beeld krijgt van de risico’s voor elke, kleinere "gewichtsklasse". In de NEJM studie keek men ook verder: de buikomtrek en de verhouding tussen buik- en heupomtrek werden mee geanalyseerd. En die twee laatste blijken veel betere “biomarkers” te zijn wanneer je de gezondheidsrisico’s van een individu wil inschatten. Het relatieve risico verhoogt om te beginnen niet lineair met je BMI. De risico curve vertoont een duidelijke dip – met het laagste risico – bij een BMI van 25,3 bij mannen en 24,3 bij vrouwen. Uit de NEJM studie kan je dus al meteen afleiden dat je wel een lichtjes hogere BMI mag hebben dan tot nu toe aangeraden werd, maar dat een zeer lage BMI ook hogere risico's inhoudt. Het is echter vooral van belang waar het eventuele overgewicht en het vet zit. Hoe kleiner de buikomtrek, hoe kleiner het risico. Hoe lager de verhouding buik-/heupomtrek hoe beter. Een eenvoudige vuistregel. Dat zullen ze daar in Beieren misschien niet graag horen, maar het is blijkbaar wel zo. Bij een “slechte” BMI is het risico vooral cardiovasculair en kanker; bij een “te grote” buikomtrek is het risico eerder respiratoir. De studie geeft ook een meer uitleg bij de mechanismen die spelen bij een slechte vetverdeling en ze scherpt de resultaten nog verder aan door te kijken naar de combinatie van BMI, buik-/heupomtrek met – al dan niet – roken. Gevolgen
“Gezondheid is Gedrag”. Zeker wanneer het gaat over gewicht, wordt onze gezondheid bijna volledig bepaald door wat we eten en hoe we bewegen. Beiden zijn hoofdzakelijk gedraggebonden. Maar gedrag is geen rationeel beestje. Wel integendeel: we gedragen ons hoofdzakelijk op basis van (snelle) percepties, vooroordelen en “geloof” in bepaalde waarheden. We luisteren daarbij eerder naar ons “buikgevoel”, dan naar ons rationeel verstand. EBM is heel rationeel en "juist", maar het is een bijzonder inefficiënt en zelfs gevaarlijk wapen wanneer je het wil inzetten om gedrag te veranderen. Cijfers en statistieken kunnen je heel makkelijk op het verkeerde been zetten en zelfs wanneer er bewijzen op tafel liggen, geloven we ze vaak niet, omdat ze niet "in ons kraam passen" van vroeger verworven kennis en visie. Zoals we volgende week in de boekbespreking zullen zien, zijn we op dat ogenblik vaak heel selectief blind. Maar het gevaarlijkste is eigenlijk de algemene pers, die dergelijke studies snel en vaak vertekend onder de publieke aandacht brengt. Dan worden we zo goed als volledig door ons buikgevoel aangestuurd en wordt het daarna heel moeilijk om terug te keren naar een correcte, logische of sluitende vuistregel, die ons helpt om ons gedrag in de juiste, gezonde richting te duwen. Enkele heldere grafieken, die je als vuistregel makkelijk kan uitleggen en onthouden, zijn dan vaak beter om mensen te motiveren dan een zee van – weliswaar heel evidence based – cijfers en bevindingen. Kijk maar eens verder, ook onder de volgende tabel, en overtuig jezelf. Dirk BROECKX – 7 april 2013 | JAMA Conclusions:
Relative to normal weight, both obesity (all grades) and grades 2 and 3 obesity were associated with significantly higher all-cause mortality. Grade 1 obesity overall was not associated with higher mortality, and overweight was associated with significantly lower all-cause mortality. The use of predefined standard BMI groupings can facilitate between-study comparisons. | TEMPiS Conclusion:
Overweight and obese patients with stroke or TIA have better survival and better combined outcomes of survival and non-fatal functional status than patients with the BMI <25 kg/m2. Mortality was significantly lower in obese patients (all BMI >30 kg/m2) than patients with normal weight. Underweight patients had consistently the highest risks for all endpoints. | NEJM Conclusion:
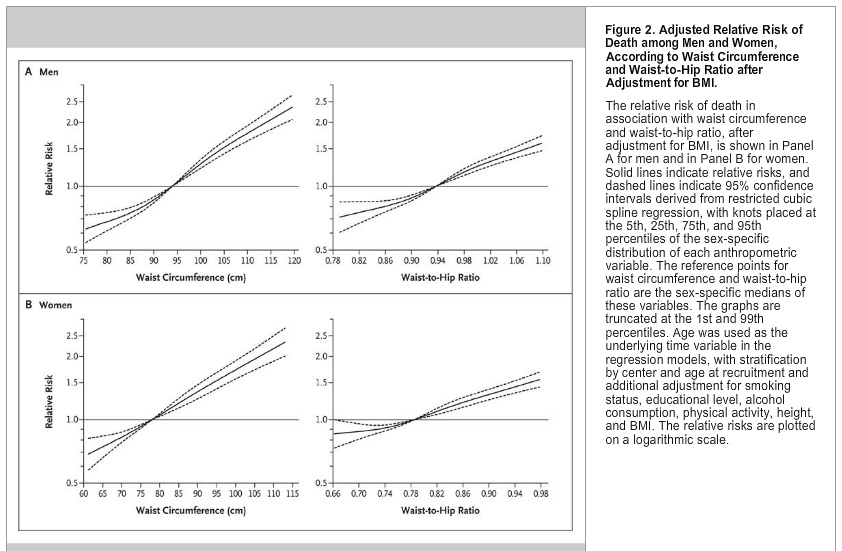
These data suggest that both general adiposity and abdominal adiposity are associated with the risk of death and support the use of waist circumference or waist-to-hip ratio in addition to BMI in assessing the risk of death.
There was a significant nonlinear association of BMI with the risk of death, with the lowest risks at a BMI of 25.3 (men) / 24.3 (women) | | Study
Study to compile and summarize published analyses of body mass index (BMI) and all-cause mortality that provide hazard ratios (HRs) for standard BMI categories. For the review and meta-analysis, the researchers identified 97 studies that met inclusion criteria, which provided a combined sample size of more than 2.88 million individuals and more than 270,000 deaths. Regions of origin of participants included the United States & Canada (41 studies), Europe (37), rest of the world (19). All-cause mortality HRs for * overweight = (BMI of 25-<30),
* obesity = (BMI of ≥30),
* grade 1 obesity = (BMI of 30-<35),
* grades 2 and 3 obesity = (BMI of ≥35) were calculated relative to * normal weight (BMI of 18.5-<25). The researchers found that the summary HRs indicated: * a 6 percent lower risk of death for overweight = (BMI of 25-<30); * a 5 percent lower risk of death for grade 1 obesity = (BMI of 30-<35); * and a 29 percent increased risk of death for grades 2 and 3 obesity = (BMI of ≥35). | Study
Study to evaluate the association of the body mass index (BMI) with mortality and with non-fatal functional outcome in patients with acute stroke or transient ischaemic attack (TIA). Data from 4428 patients with TIA from the Telemedical Project for Integrative Stroke Care (TEM-
PiS) were studied in a post hoc analysis. The body mass index was available in 1521 patients. Patients were categorized as * underweight (BMI <18.5),
* normal (BMI 18.5 to <25)
* overweight (BMI 25 to <30),
* obesity (BMI 30 to <35),
* advanced obesity (BMI ≥35 all kg/m2),
* (no body weight assessed). Outcome measures after 30 months were all-cause mortality and non-fatal outcomes: recurrent stroke, need for institutional care, and functional impairment. Mortality risk was
* lower in overweight patients (hazard ratio HR: 0.69)
* lowest in obese (HR: 0.50) and very obese patients (HR: 0.36)
* compared with normal BMI. Functional, non-fatal outcomes, and recurrent stroke followed the same inverse pattern:
* underweight patients had the worst outcomes
* obese patients had better outcomes
* than patients with normal BMI (all P < 0.01). | Study
Study to examine the association of BMI, waist circumference, and waist-to-hip ratio with the risk of death among 359,387 participants from nine countries in the European Prospective Investigation into Cancer and Nutrition (EPIC). During a mean follow-up of 9.7 years, 14,723 participants died. The cohort was divided into categories of BMI that were similar to those used for the National Institutes of Health–AARP cohort (<18.5, 18.5 to <21.0, 21.0 to <23.5, 23.5 to <25.0, 25.0 to <26.5, 26.5 to <28.0, 28.0 to <30.0, 30.0 to <35.0, and ≥35.0). There was a significant nonlinear association of BMI with the risk of death, with the lowest risks at a BMI of 25.3 among men and 24.3 among women, and increased risks in the lower and upper BMI categories. After adjustment for BMI, waist circumference and waist-to-hip ratio were strongly associated with the risk of death. (See images below). The relative risks of death associated with a high BMI were strongest for circulatory causes of death, followed by other causes and neoplasms, whereas the relative risks associated with a high waist circumference or waist-to-hip ratio were strongest for respiratory causes of death, followed by other causes. | 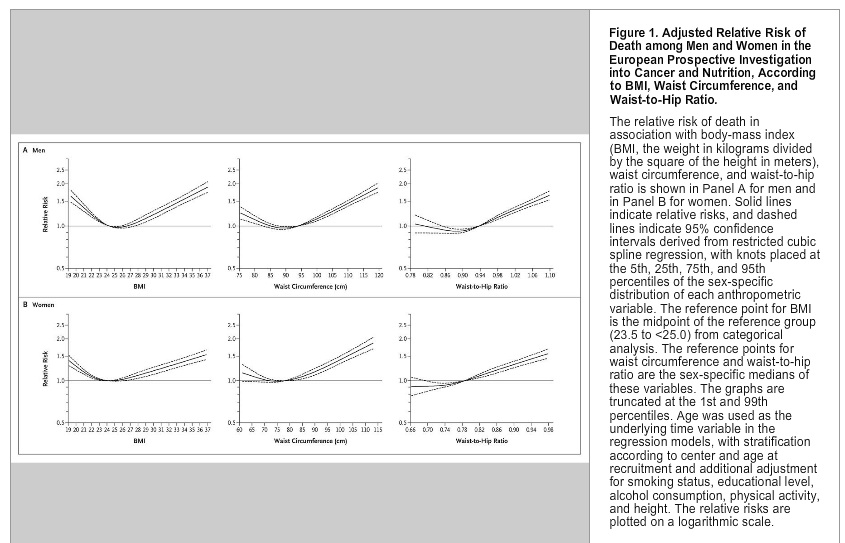
En ziehier de oorspronkelijke blog, die me aan het denken zette: | Obesity: A very weighty dispute DocCheck News by Philipp Graetzel, 04.04.2013 Is obesity no risk factor at all for life and limb? New studies point in this direction. Yet the matter is not so simple. What these works show in particular is that BMI thresholds or the BMI parameters are problematic in themselves. Rarely had one seen doctors go at each other such as they did after the publication of a meta-analysis released earlier this year on the relationship between total mortality and obesity. A research group under Katherine M. Flegal of the U.S. Food and Drug Administration Center for Disease Control and Prevention viewed over 7,000 scientific published papers in producing a publication in the Journal of the American Medical Association (2013, 309 (1):71-82). Remaining for a meta-analysis at the end were 97 papers of higher quality, involving a total of at least 2.88 million subjects who had participated, 270,000 of whom had died. It was therefore not a very small data pool. What the CDC experts then produced was a relatively simple analysis. They took the usual BMI categories, that is normal BMI (18.5 up to 25), overweight (25 up to 30), grade I obesity (30 up to 35) and grade II / III obesity (35 and higher). These were correlated with total mortality. Results: the overweight, with a Hazard Ratio of 0.94, compared to those of normal weight had a significantly lower risk of death. The risk for obese people in all categories was, with a Hazard Ratio of 1.18, significantly elevated. Where only those people with grade I obesity were analysed, the risk of death was the same as for normal weight. So it was primarily the very obese people who made an impact on increased mortality in the general population of overweight individuals. Presumably because they had guessed what they would be unleashing, the scientists provided a second analysis in which they considered only those studies which were adequately adjusted for age, sex and smoking status, but not for chronic diseases. The result went in the same direction. Not so squeamish: U.S. experts cause a stir
This publication is still making waves. In Germany it has been widely reported, the general tone being that a bit of excess weight is not so bad after all. In the U.S. the main thrust of the media coverage was similar. In particular however it was the medical establishment there that elbowed its way through to also have its say. "A pile of rubbish", states Walter Willett of the Department of Public Health with regard to the meta-analysis. He even suggested publicly that it should not even be read. He did not say that one should instead rather read his own work, but presumably that is what he meant. Unfortunately, from a German perspective during the whole hoopla another study published in the European Heart Journal at the same time was somewhat overshadowed (2013 34 (4) :268-277). This study is based on data from the Bavarian stroke network TEMPiS, that is an unselective cohort of stroke patients in clinics “in the hills and dales”. The TEMPiS neurologists looked over how high the risk of death in stroke patients is with reference to the BMI categories. These results are also quite remarkable. Stroke patients who are overweight according to BMI categories have, in comparison with normal-weight people, a Hazard Ratio for all-cause mortality of 0.69. With grade I obesity the Hazard Ratio was 0.50, with grade II / III obesity as low as 0.36, all significantly high. Boundary shift changes the picture
The question now is: What to do with this information? Not reading is in any case not an option. Accurately reading might help. Whoever interprets from the meta-analysis in JAMA that each additional pound prolongs life – as some media reports have suggested – has simply read it wrong. Across all categories of the overweight the total mortality compared with normal BMI class is higher by 18 percent. And for grade I obesity, it is at any rate not lower, but "merely" equal. Something comes into play obviously in the group who, according to the BMI criteria, are overweight people. These at any rate clearly live longer than the normal-weight people. That this applies only to the overweight people who are healthy is not true, even though many professional commentators have claimed such. The authors have with their second analysis nonetheless made an effort to come up with, what is in their view, "correctly" adjusted studies, ie studies that were adjusted only for sex, age and smoking status, to take into consideration the factor of obesity-associated illness. Well trained = Overweight?
The crucial problem of the meta-analysis is another: its stratification via BMI. And here we are at a point where we really learn nothing new. An assessment of excess weight and obesity only using BMI is already problematic because in the lower range of the BMI category "overweight" a lot of well-trained athletes turn up in statistics who – this is the current hypothesis – may be responsible for the surprisingly good performance for the overweight group in the U.S. meta-analysis. More revealing, as every doctor knows, would be waist circumference or the waist-hip ratio. This however in many studies is simply not available. Aside from this category covering "slightly overweight" people, there may perhaps exist an additional difficulty in a second "problem area" of BMI, namely the transition region between underweight and normal weight. In the meta-analysis by Katherine Flegal, the underweight according to BMI people have a significantly increased risk of death. So another reason for the poor performance of the normal weight group according to BMI could be that the lower limit of normal weight (BMI as 18.5) is far too low. It would be interesting, therefore, to see what would happen if the normal interval of BMI would be shifted to a test range between say 20 and 27. More reserves in an acute emergency?
An analysis of this unfortunately does not exist in Katherine Flegal's work, but in another source such data clearly exists. For this reason as well, the virtually global excitement over the Flegal meta-analysis is not really comprehensible. In 2008, the New England Journal of Medicine (NEJM) published a European study in which smaller intervals for the BMI groups were chosen (New England Journal of Medicine 2008, 359:2105). Results: the lowest mortality was found at a BMI of about 25 for men and 24 for women. And overall within a BMI corridor of about 21 up to about 28 there are no major differences. Conclusion: monomaniac fixation on BMI is not a good idea.
Nevertheless: the results of the German stroke study cannot be explained away by shifting the BMI categories. Much more so, in this study the relative benefit rises fairly steadily with BMI. However the situation here is of course completely different: in the meta-analysis from the United States it is about ”chronic” overall survival, with stroke patients it is about acute mortality in a life-threatening situation. Perhaps the rather flat presumption that every pound means more additional reserves in such situations has a justification. This is yet again just a hypothesis. | Bronnen en ©: DocCheck News, JAMA,EurhaertJ. en NEJM.
Links naar de samenvattingen van de studies in JAMA en TEMPIS in European Heart Journal (volledige artikels alleen tegen betaling) en link naar het "open source" artikel in NEJM. |